An official website of the United States government




1. Introduction
PAGE is a Java application designed to extract and visualize phase-shifted patterns of gene expression data involving dose, time, and biological responses. To use PAGE, users must first load the gene expression data and then run q-Cluster analysis. This user manual serves as a reference on using PAGE in a step-by-step fashion.
2. Software Requirement
The following software must be installed in order to execute PAGE.
- Java 2 Runtime Environment, Standard Edition 1.4.2 or later
3. Getting Started
- Double click on PAGE.bat
4. Load Experiment
PAGE uses tab-delimited text file as input. This input file contains gene expression data at various dose and time points. The following subsections explain the input file format and the step-by-step description of how to load the input file into PAGE for single and multiple experiments, including how to load and save experiment configuration.
4.1 Input File Format Description
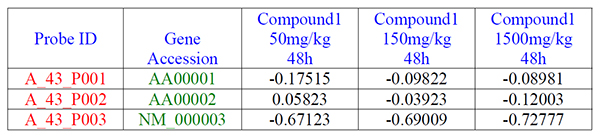
- The input file must be tab-delimited text file.
- The file must not have any empty space between tabs.
- The first row is consisted of header labeling each column as shown in blue.
- The first column contains the unique row identifiers as shown in red.
- The second column contains the gene accession numbers as shown in green.
4.2 Load a Single Experiment
To load an experiment from a tab-delimited file:
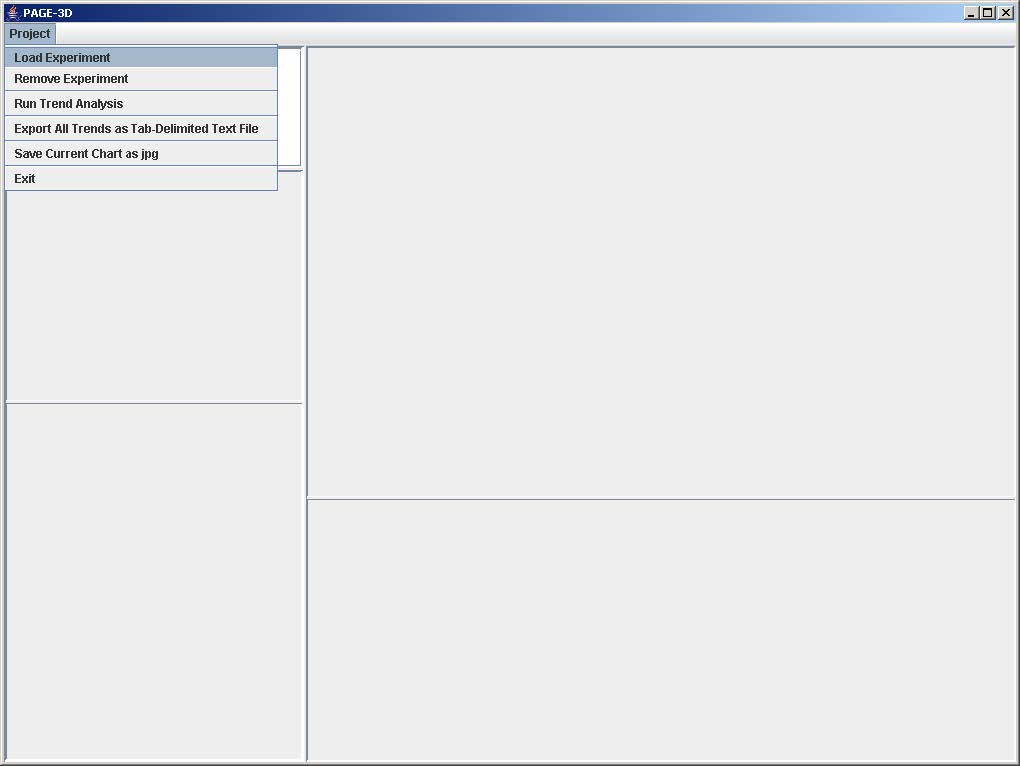
1. Click on Project and select Load Experiment
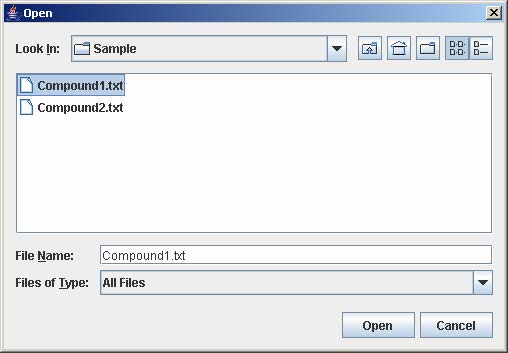
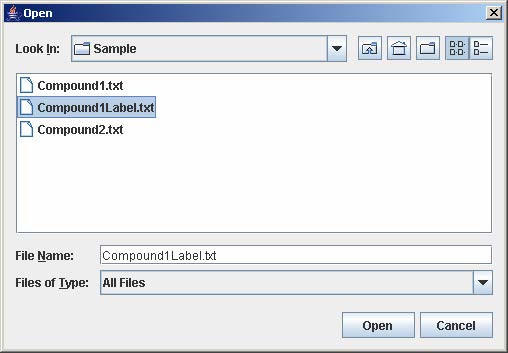
1. On the file chooser window, go to the directory containing the input file and enter the input filename. Then, click Open.
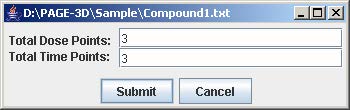
2. Enter the number of dose and time points that corresponds to the experiment being loaded. Then, click Submit.
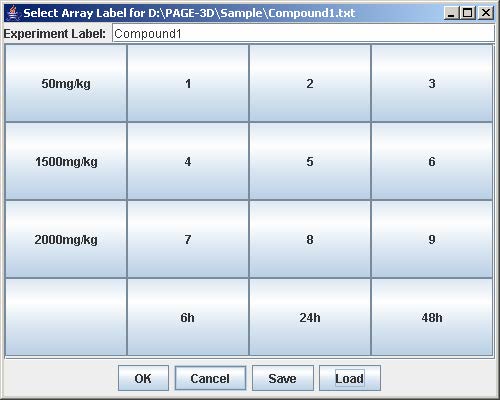
3. Enter the experiment label in the text field
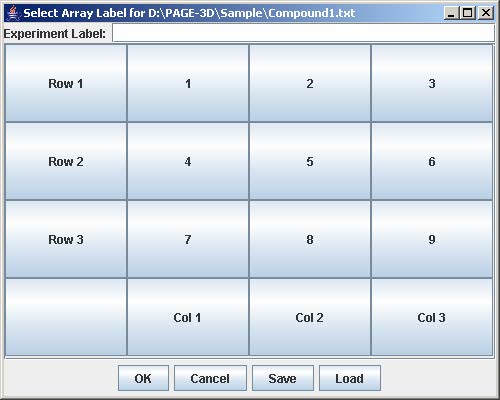
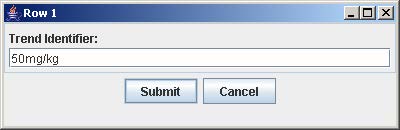
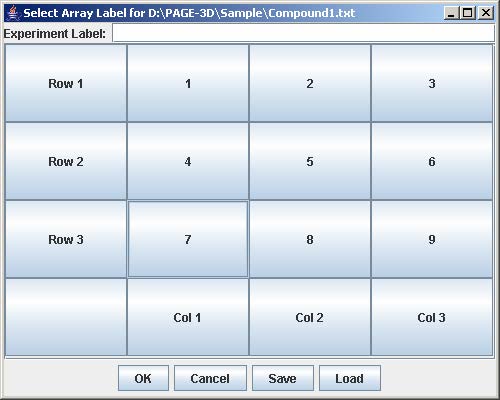
4. Click on the button with “Row #” to label the corresponding row. Enter the trend identifier and click Submit. Repeat this step for each button labeled with “Row #”.
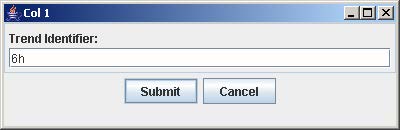
5. Click on the button with “Col #” to label the corresponding column. Enter the trend identifier and click Submit. Repeat this step for each button labeled with “Col #”.
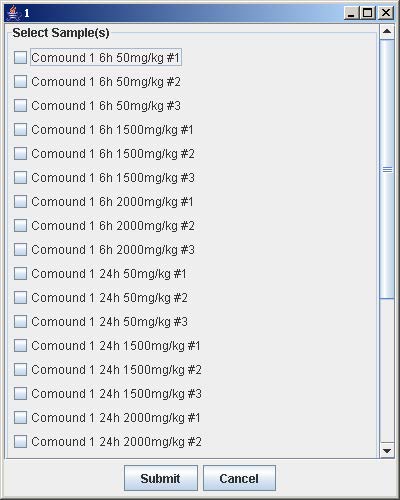
6. Click on the button with a number on the “Select Array Label” panel to select the sample(s) that correspond to the dose and time labels for each row and column. At least one checkbox must be selected. Click Submit when finished. Repeat this step for each button labeled with a number on the “Select Array Label” panel.
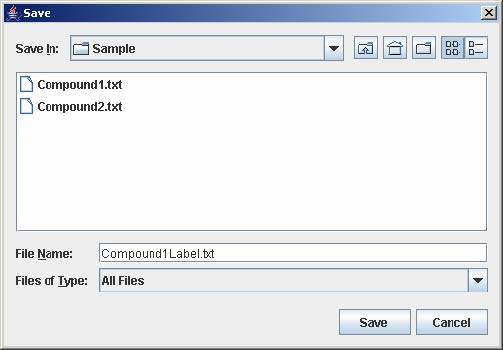
7. Click Save to open the file chooser window. Enter the filename and click Save to save the experiment configuration. This step is optional but necessary to avoid repeating the previous steps when the same experiment is being loaded again.
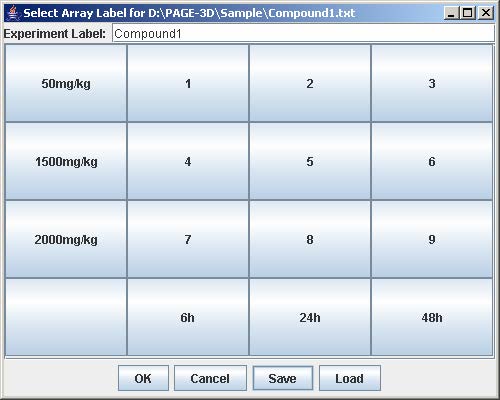
8. Click OK to load the experiment.
4.3 Load Multiple Experiments
- To load multiple experiments onto the same project, repeat steps 1 to 8 in Section 4.2 for each experiment.
4.4 Load Experiment Configuration
To load experiment configuration that have been previously saved, click Load to open the file choose window. Then, select the file containing the experiment configuration and click Open. This step skips steps 4-8 in loading a single experiment.
5. Remove Experiment
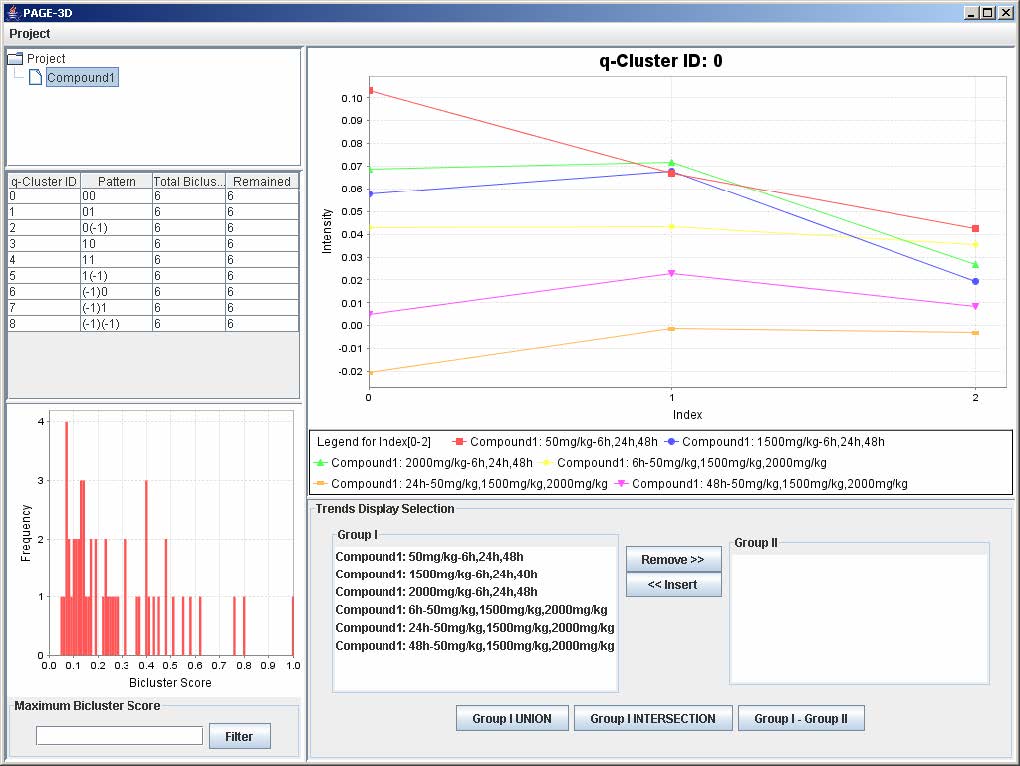
1. Click on an experiment node from the tree panel.
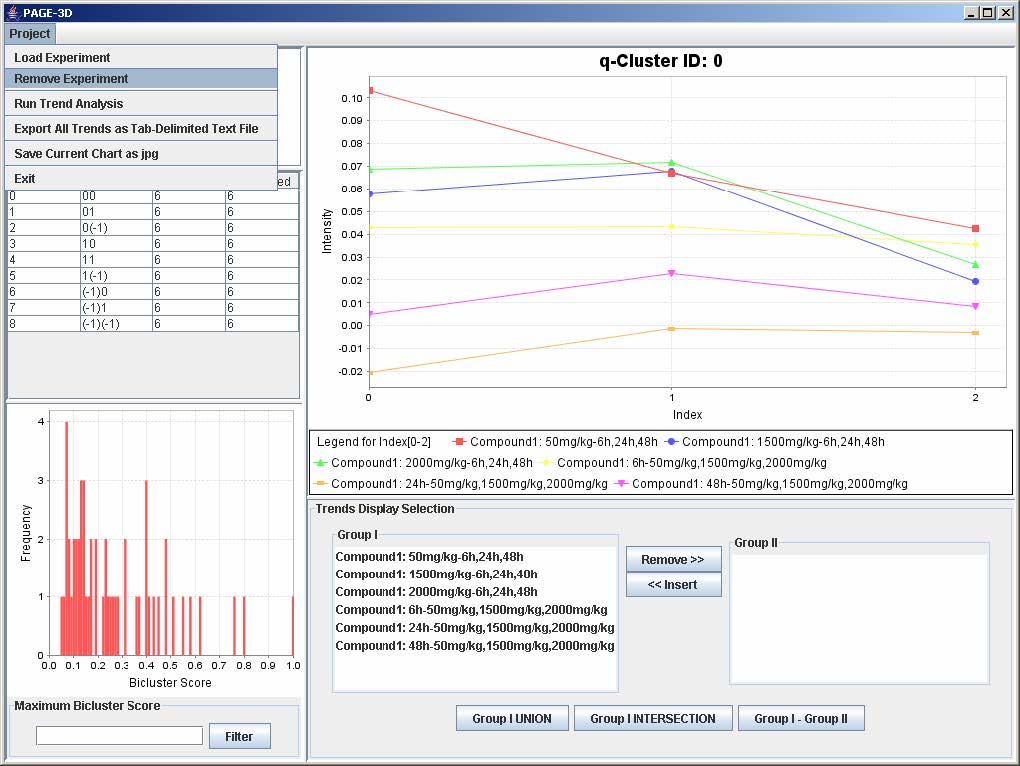
2. Click on Project and select Remove Experiment.
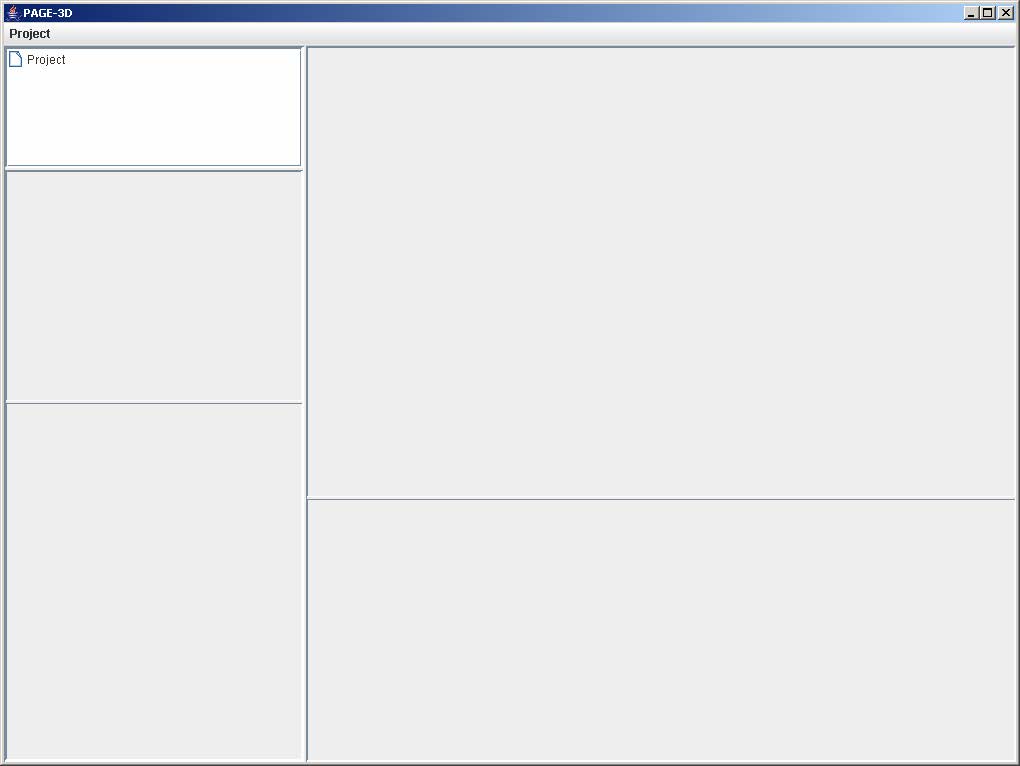
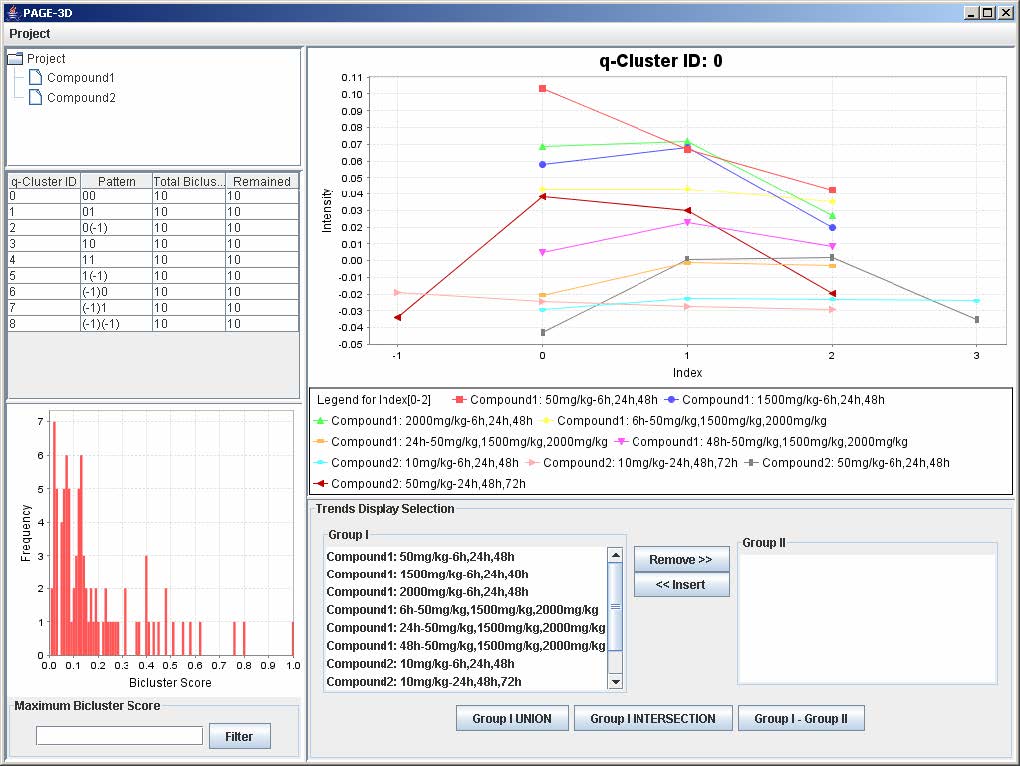
6. Run Trend Analysis
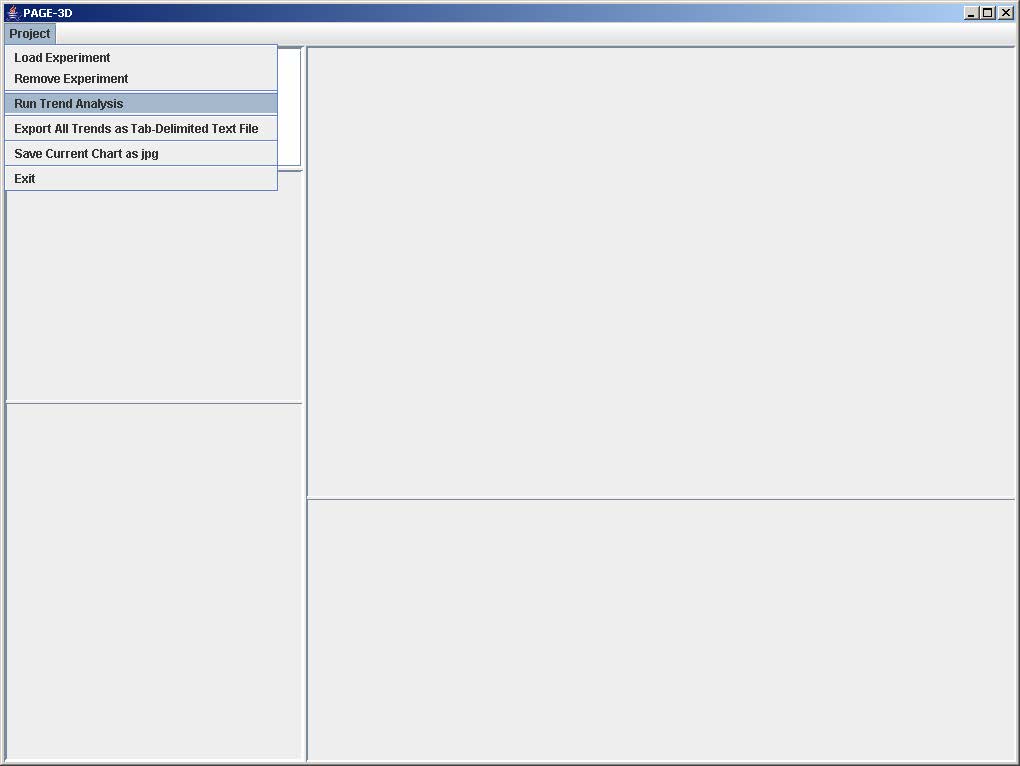
1. Click on File and select Run Trend Analysis
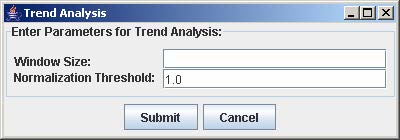
2. Enter the window size and the normalization threshold value. The window size is the number of consecutive points fixed for the trend length. The normalization threshold (default value = 1.0) is the cut-off for defining an upward or downward trend from one point to the next.
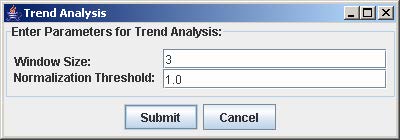
3. Click Submit
7. Save as Tab-Delimited File
1. Click on Project and select Export All Trends as Tab-Delimited Text File
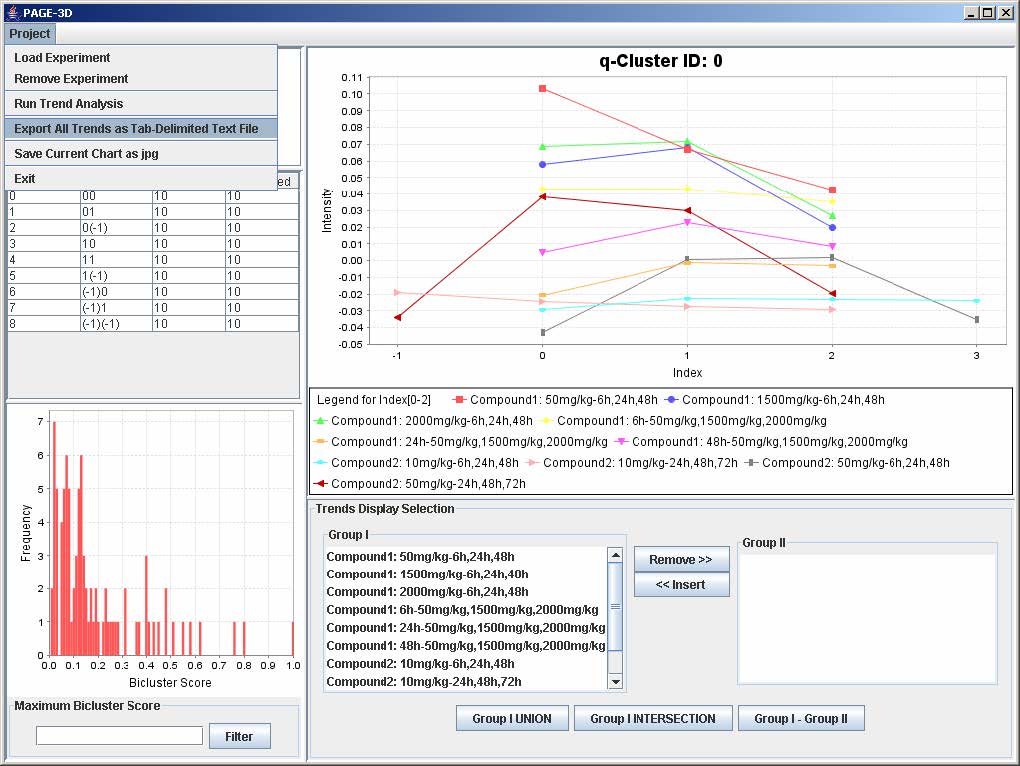
2. Enter the filename and click Save to save the results in a tab-delimited text file.
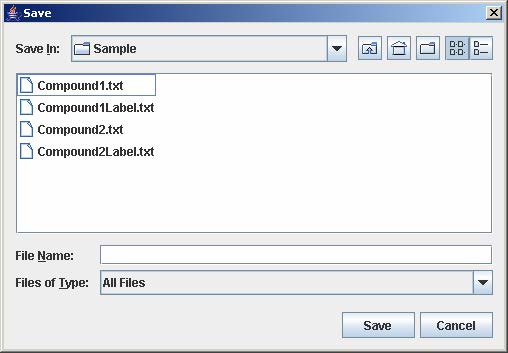
8. Save Current Chart
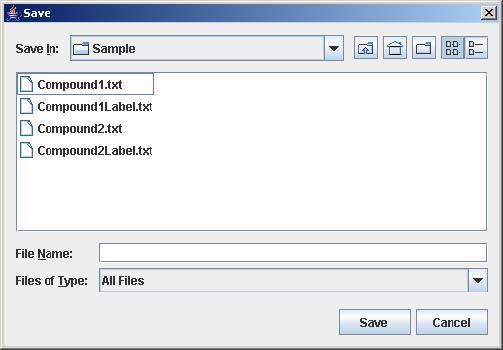
1. Click on Project and select Save Current Chart as jpg.
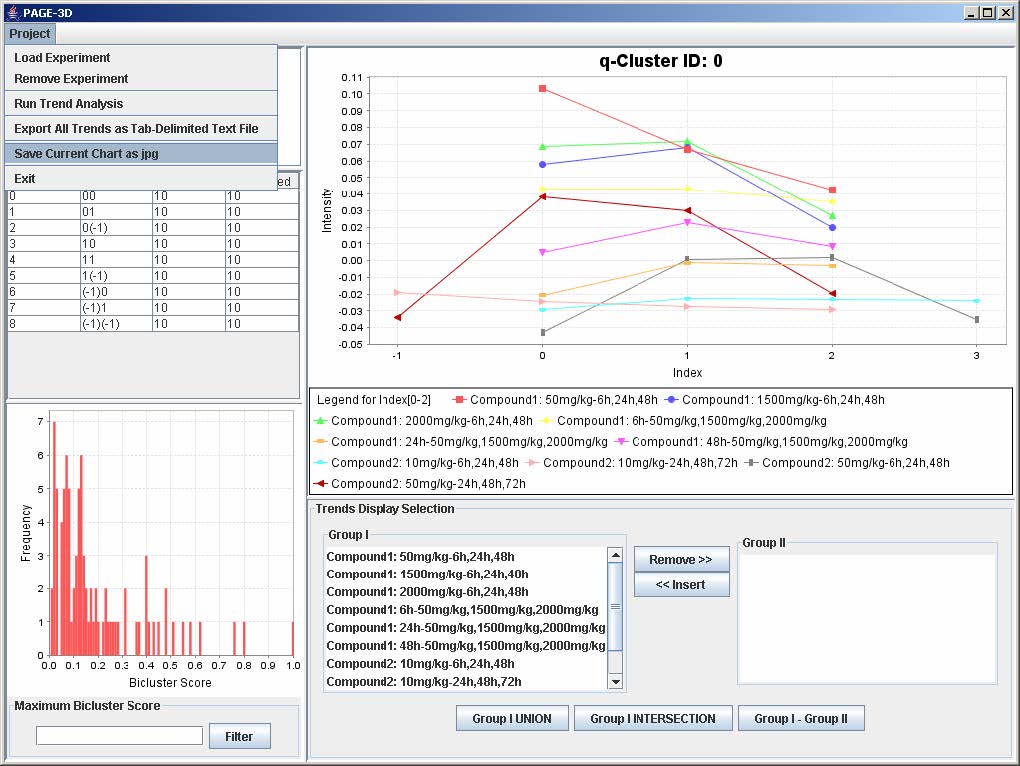
2. Enter the filename and click Save. PAGE will automatically append the .jpg extension to the filename entered by the user.
9. View Trend
9.1 Setting the Maximum Threshold of Bicluster Score
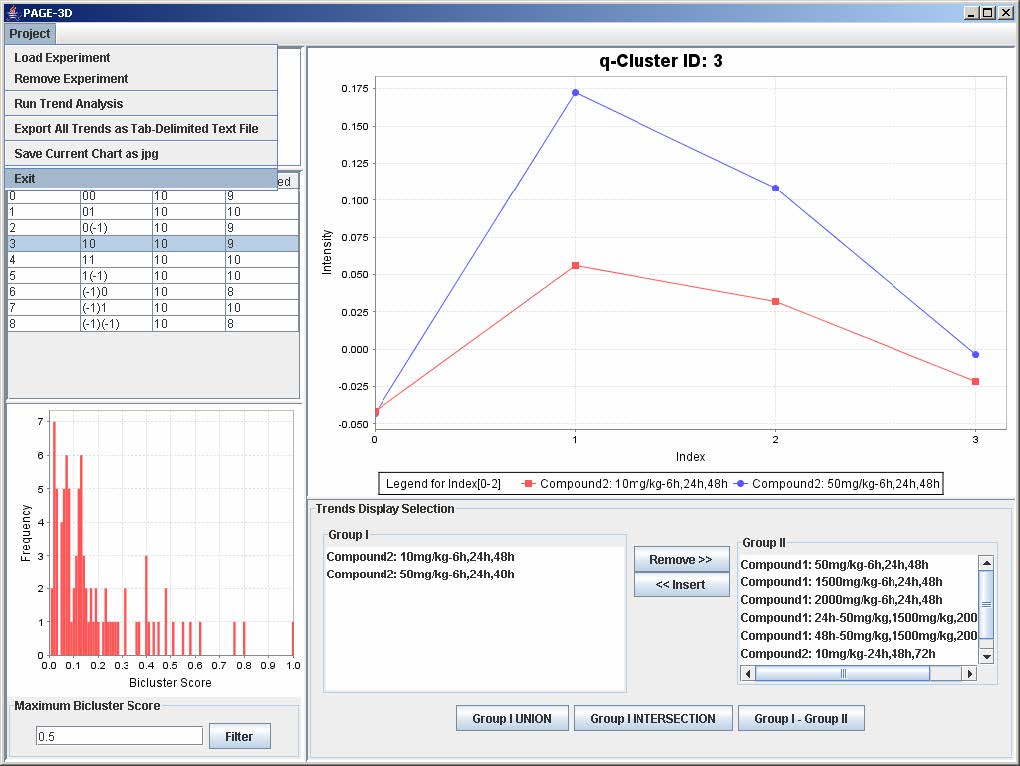
1. Enter a number between 0 and 1 to remove any bicluster above the bicluster threshold.
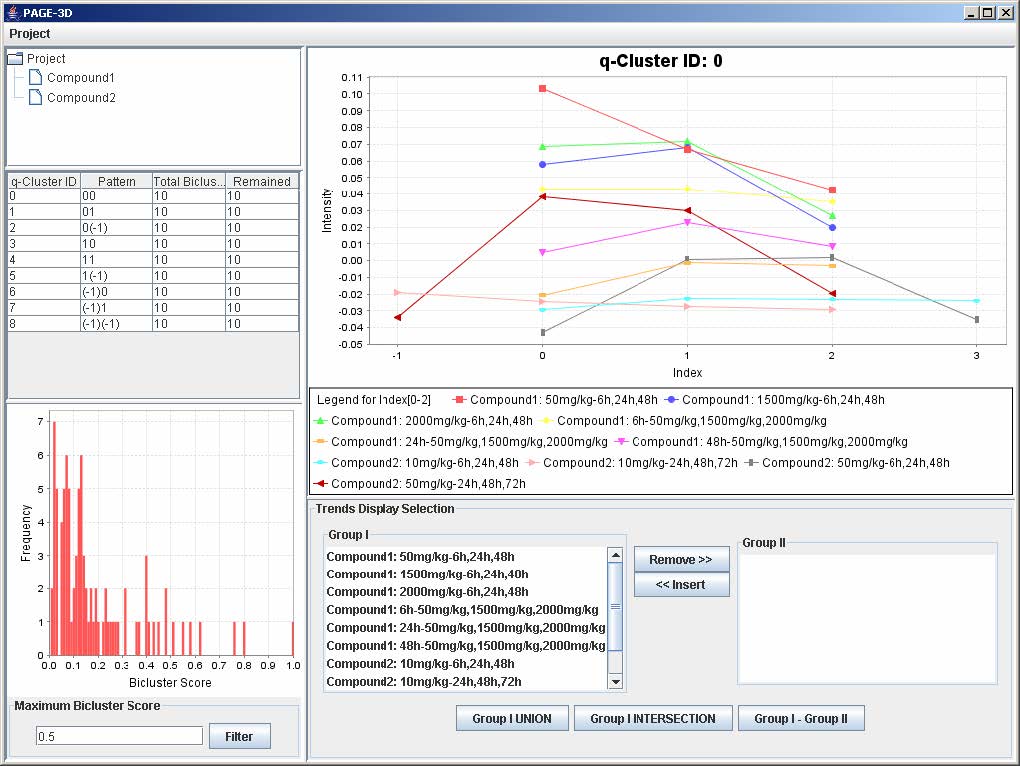
2. Click on Filter to apply the bicluster threshold to the analysis.
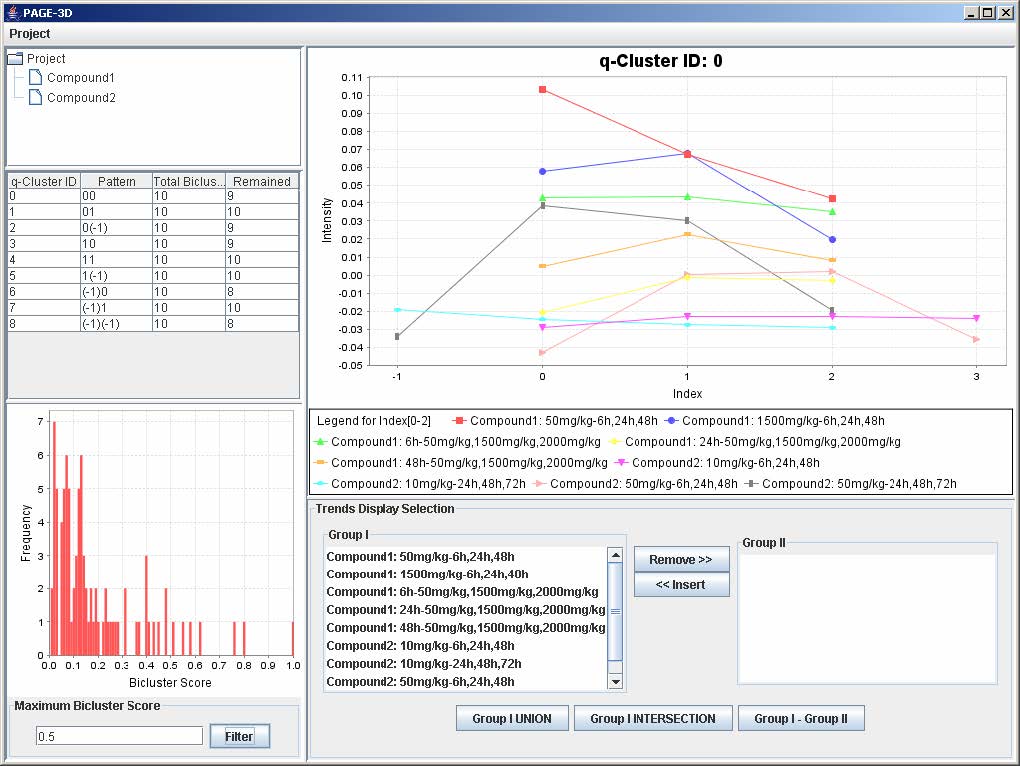
3. Click on any row in the table on the left panel to view the corresponding q-Cluster.
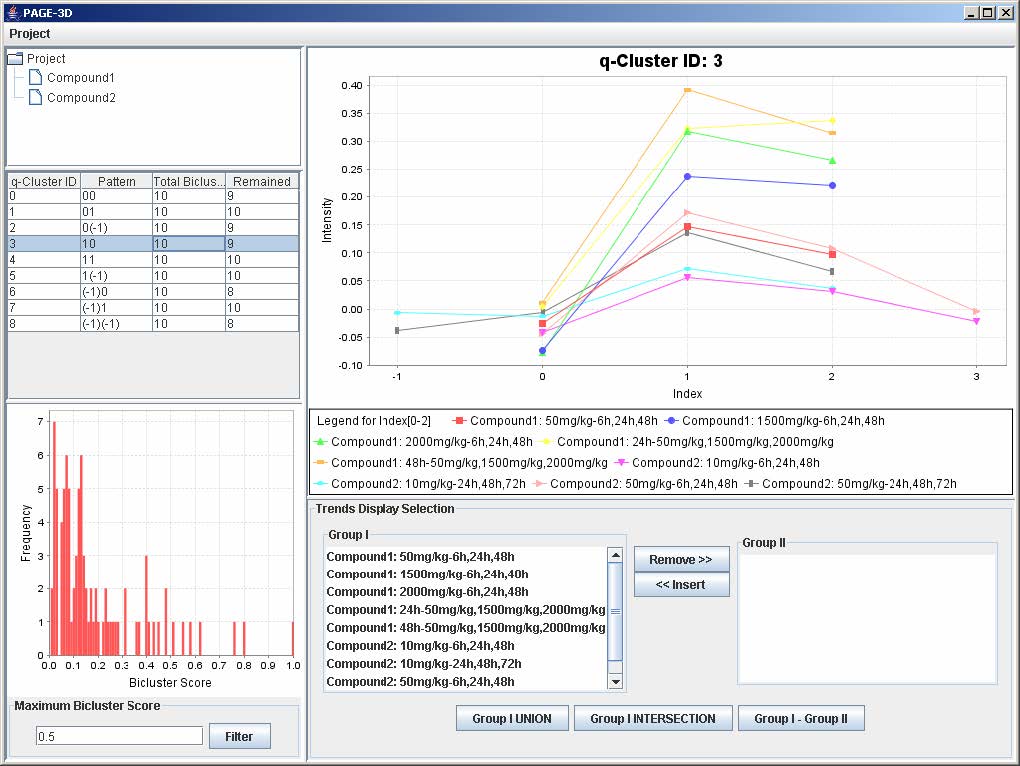
9.2 Selecting Trends
1. To remove any trend in the selected q-Cluster, go to the Trend Display Selection panel and highlight the desired trends in Group I.
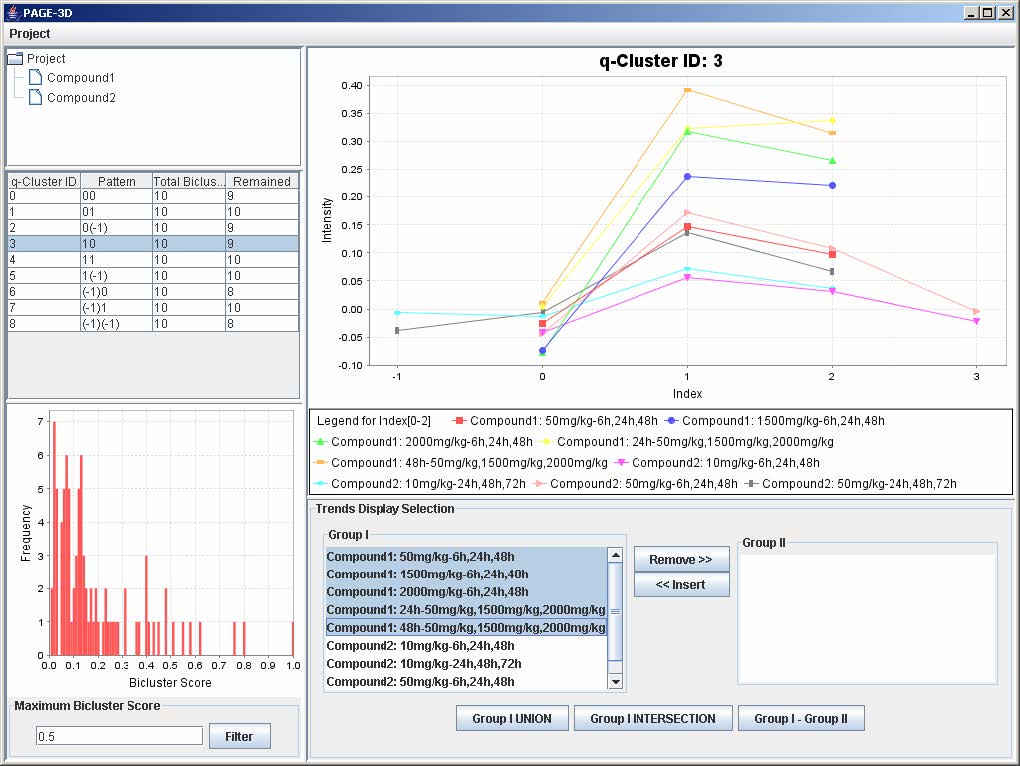
2. Click on the button “Remove >>”
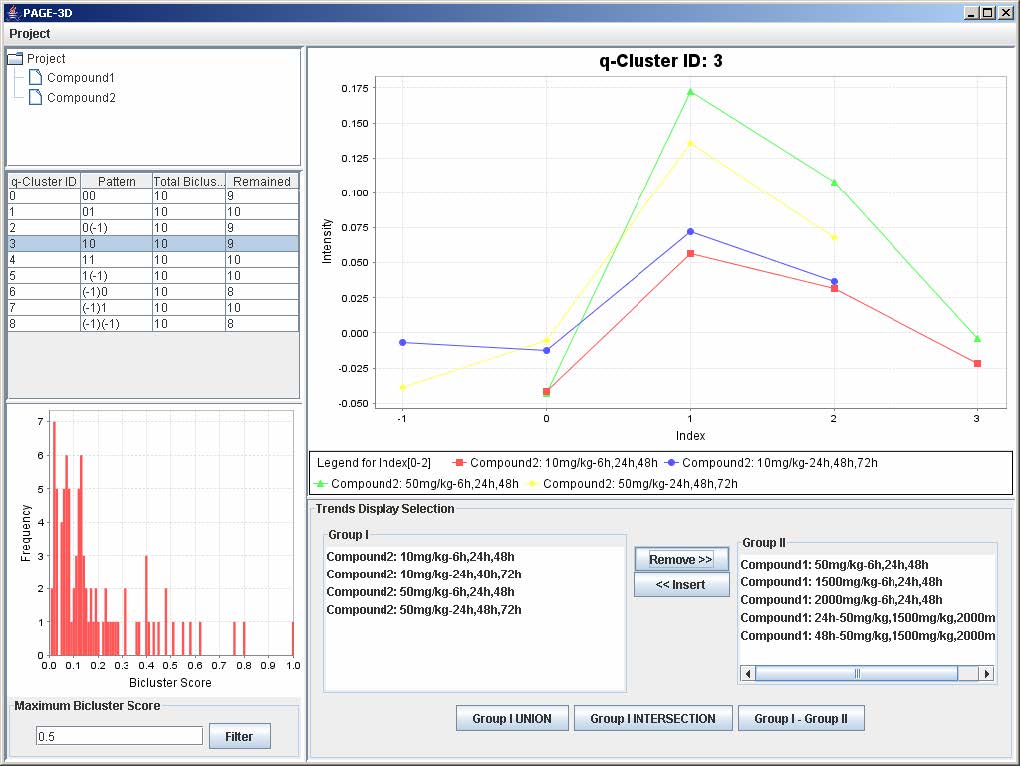
3. To insert trends back into the q-Cluster, go to the Trend Display Selection panel and highlight the desired trends in Group II.
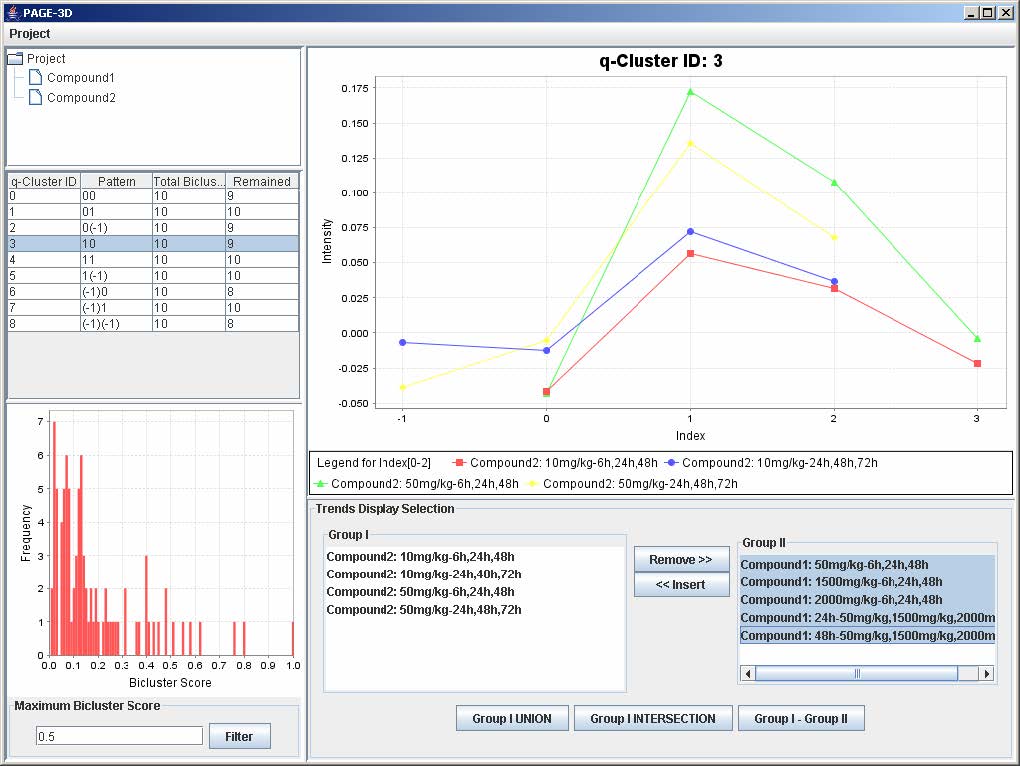
4. Click on button “<< Insert”
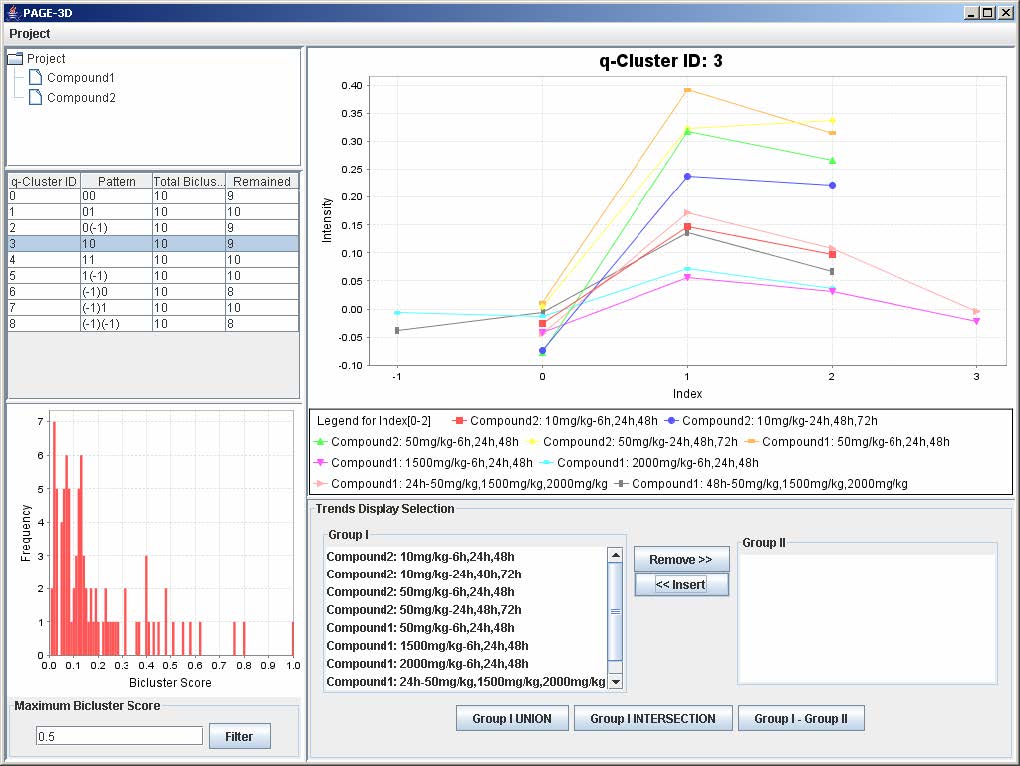
9.3 Zooming
1. Zoom-in: Drag the mouse from the upper left hand corner to the lower right hand corner to highlight the desired zone. Then, release the mouse.
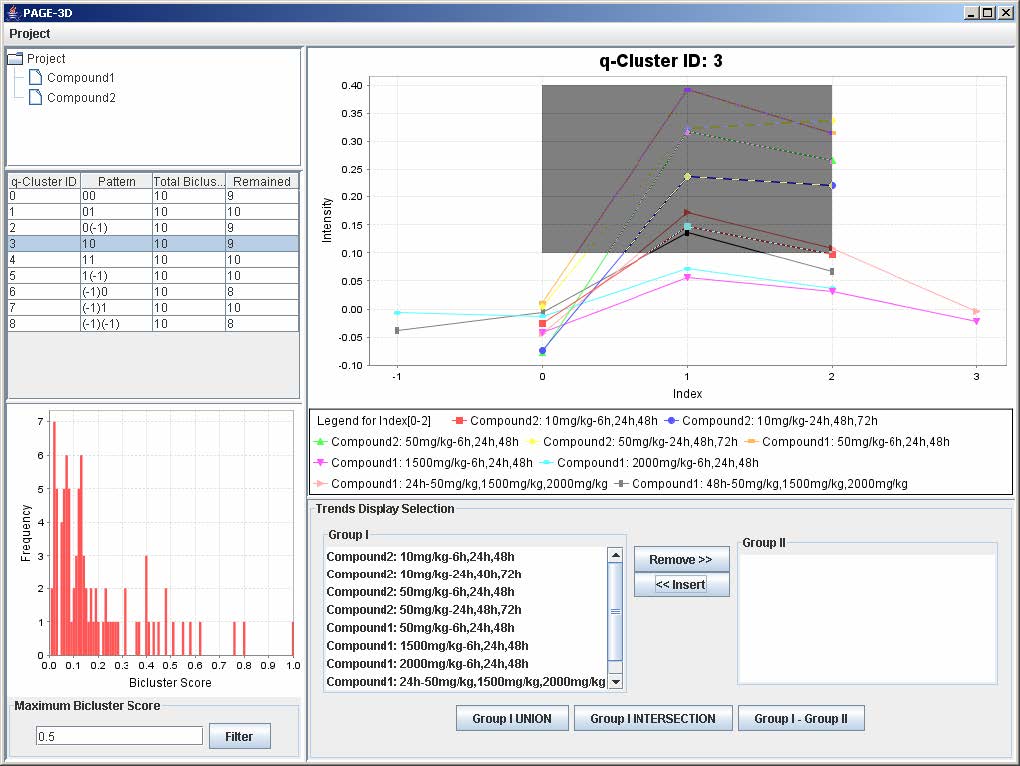
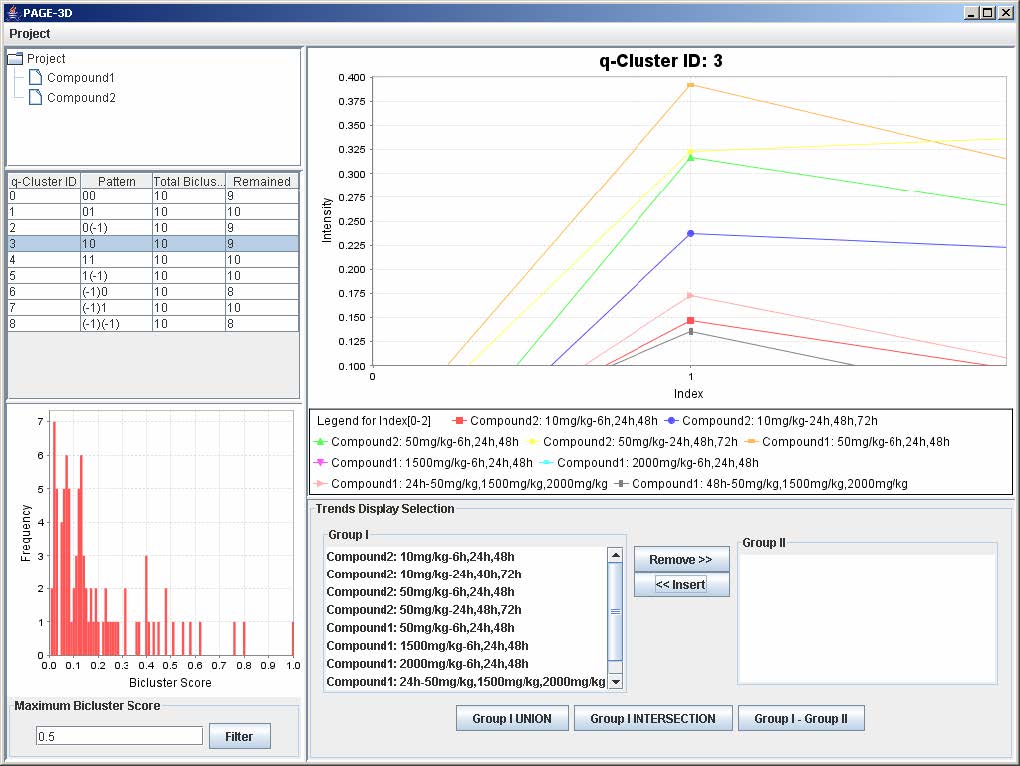
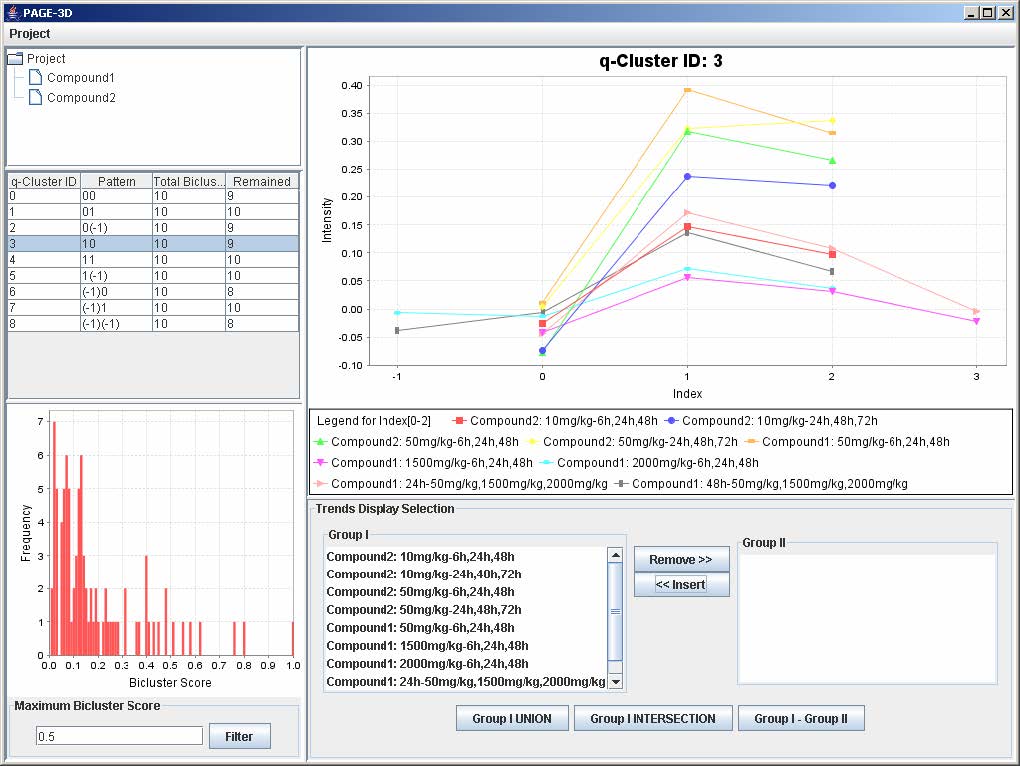
2. Zoom-out: Drag the mouse in the opposite direction on the line graph panel and release the mouse.
10. Retrieve Gene List
10.1 Union
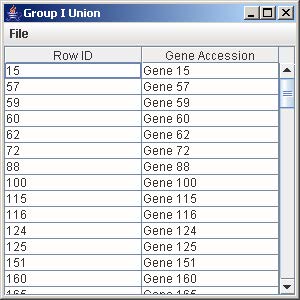
1. Click on the button “Group I Union” to generate the union of all the genes from the trends that are being displayed in the line graph panel.
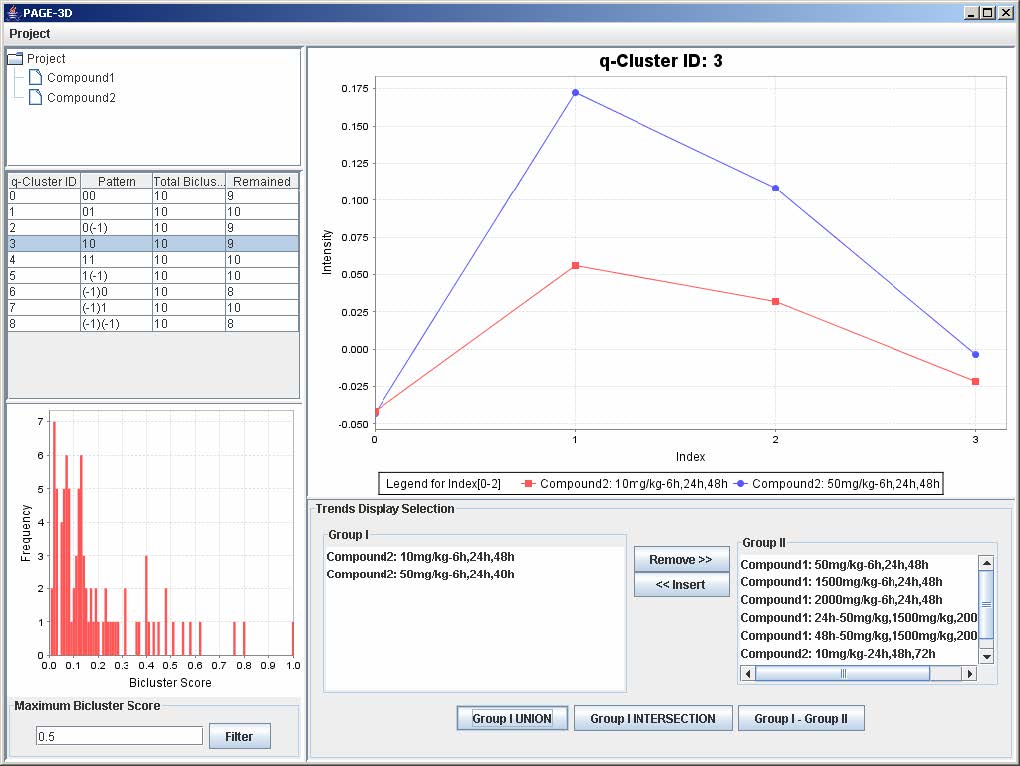
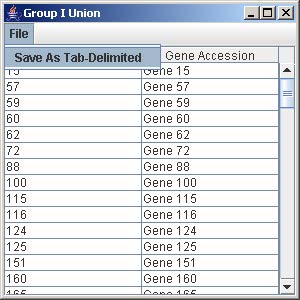
2. To save the gene list, click on File and select Save as Tab-Delimited.
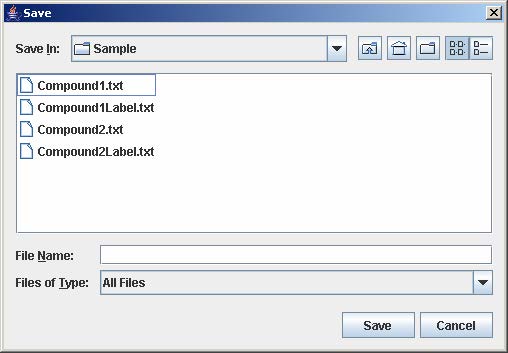
3. Enter the filename to save the gene list and click Save on the file chooser window.
10.2 Intersection
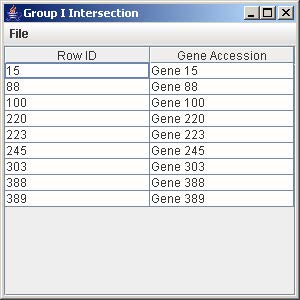
1. Click on the button “Group I Intersection” to generate the intersection of all the genes from the trends that are being displayed in the line graph panel.
10.3 Difference (Group I – Group II)
1. Click on the button “Group I – Group II” to generate the list of all the genes in Group I but not in Group II.
2. To save the gene list, click on File and select Save as Tab-Delimited.
3. Enter the filename to save the gene list and click Save on the file chooser window.
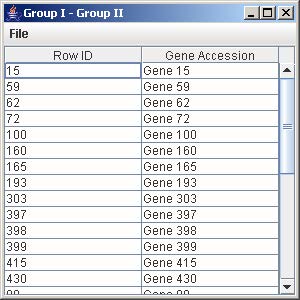
2. To save the gene list, click on File and select Save as Tab-Delimited.
3. Enter the filename to save the gene list and click Save on the file chooser window.
11. Exit
1. Click on Project and select Exit to exit the program.